


 The image above is a link to a huge diagram showing space exploration missions. I have no idea how comprehensive of missions it is. I think the original source was National Geographic so it must be rather complete. Regardless the image is stunning in a visual design sense and it makes a good desktop background. Enjoy.
Field of Science
-
-
Change of address1 year ago in Variety of Life
-
Change of address1 year ago in Catalogue of Organisms
-
-
Earth Day: Pogo and our responsibility1 year ago in Doc Madhattan

Showing posts with label visualization. Show all posts
Showing posts with label visualization. Show all posts
Space Exploration Missions
The image above is a link to a huge diagram showing space exploration missions. I have no idea how comprehensive of missions it is. I think the original source was National Geographic so it must be rather complete. Regardless the image is stunning in a visual design sense and it makes a good desktop background. Enjoy.
1/48-scale model of an F-18 aircraft

I stumbled upon Cabinet magazine recently. It is a quarterly print magazine of art and culture. The current issue No. 34 is about testing or sort of the intersection of culture and scientific testing. There is a great article available online (you will have to pick up a physical copy to read the other articles, but I did and it was worth it) about games of chance, but it was the cover image that really caught my attention:
This image shows a plastic 1/48-scale model of an F-18 aircraft inside the "Water Tunnel" more formally known as the NASA Dryden Flow Visualization Facility. Water is pumped through the tunnel in the direction of normal airflow over the aircraft; then, colored dyes are pumped through tubes with needle valves. The dyes flow back along the airframe and over the airfoils highlighting their aerodynamic characteristics. The aircraft can also be moved through its pitch axis to observe airflow disruptions while simulating actual flight at high angles of attack.
The Water Tunnel at NASA's Dryden Flight Research Center, Edwards, CA, became operational in 1983 when Dryden was a Flight Research Facility under the management of the Ames Research Center in Mountain View, CA. As a medium for visualizing fluid flow, water has played a significant role. Its use dates back to Leonardo da Vinci (1452-1519), the Renaissance Italian engineer, architect, painter, and sculptor. In more recent times, water tunnels have assisted the study of complex flows and flow-field interactions on aircraft shapes that generate strong vortex flows. Flow visualization in water tunnels assists in determining the strength of vortices, their location, and possible methods of controlling them.
The design of the Dryden Water Tunnel imitated that of the Northrop Corporation's tunnel in Hawthorne, CA. Called the Flow Visualization Facility, the Dryden tunnel was built to assist researchers in understanding the aerodynamics of aircraft configured in such a way that they create strong vortex flows, particularly at high angles of attack. The tunnel provides results that compare well with data from aircraft in actual flight in another fluid-air. Other uses of the tunnel have included study of how such flight hardware as antennas, probes, pylons, parachutes, and experimental fixtures affect airflow. The facility has also been helpful in finding the best locations for emitting smoke from flight vehicles for flow visualization.
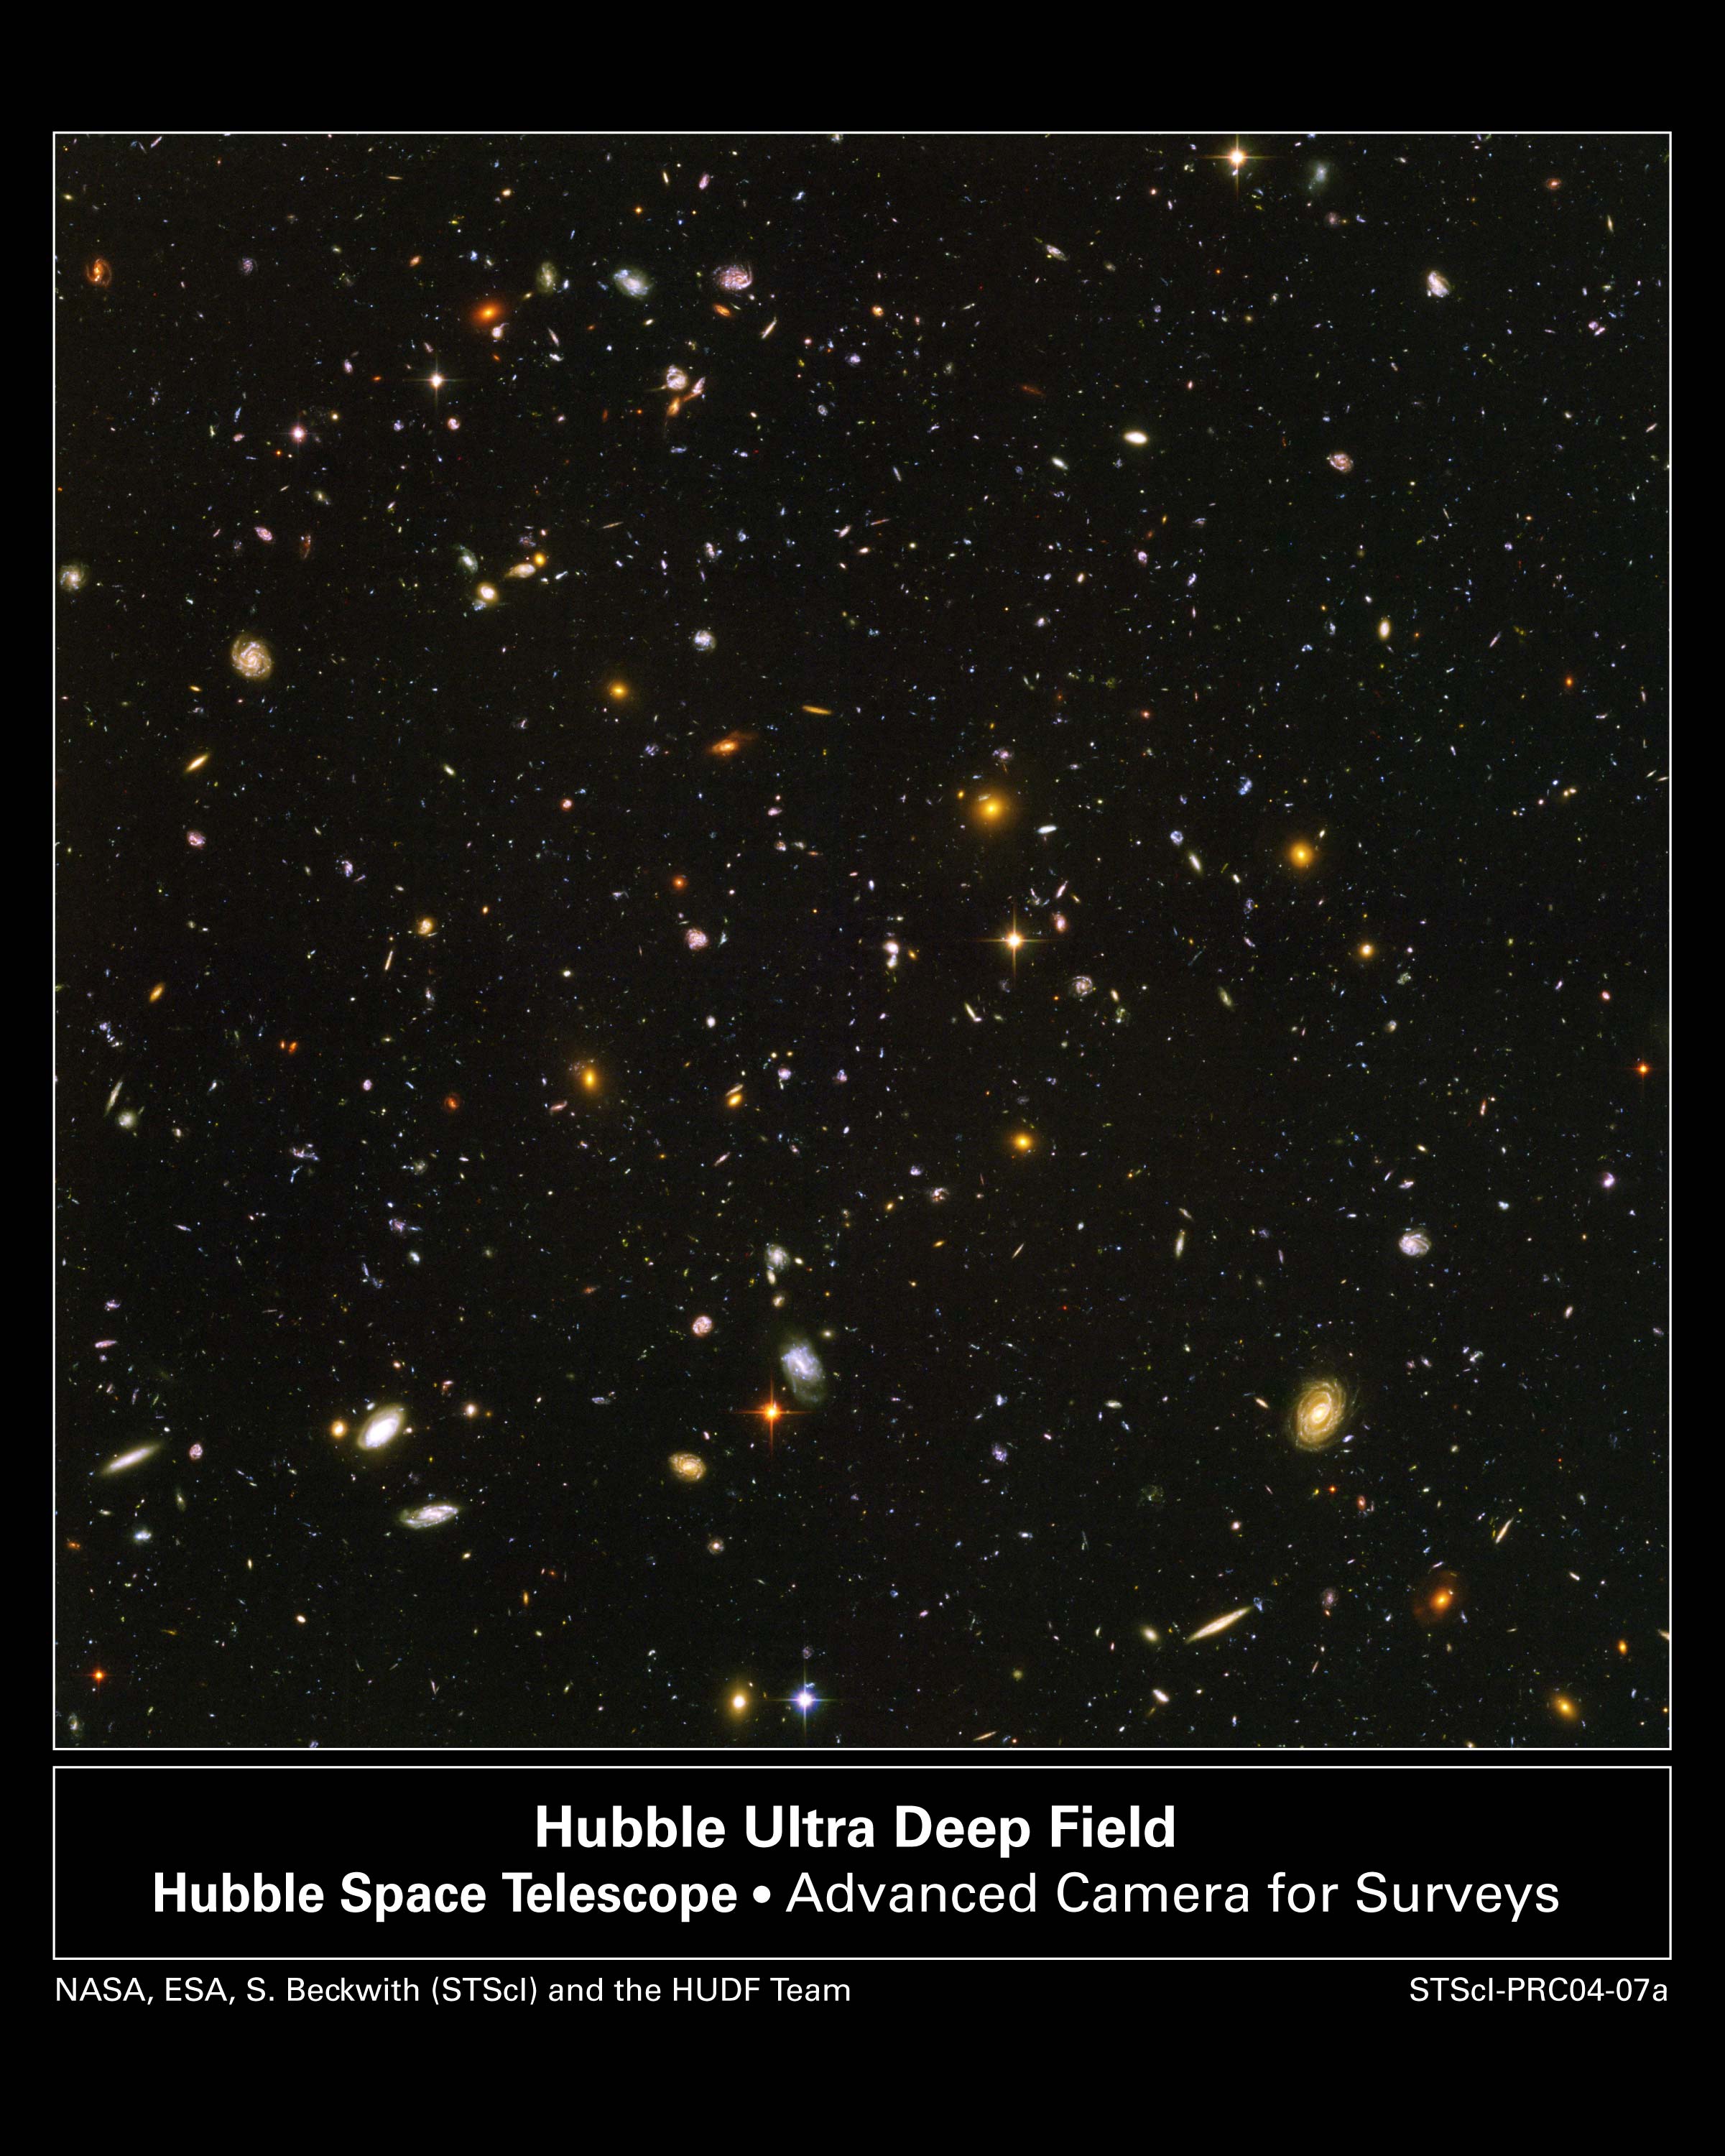
Hubble Ultra Deep Field Part 1
The Hubble Ultra Deep Field (HUDF) was a major inspiration in my decision to study astronomy. The image is simply breathtaking. The video above presents a broad overview of the science of the HUDF very well, but in my next post I will attempt to take a closer look at the subtleties of what is going on here.
To Octavio Paz
It looks like the NASA STEREO mission is continuing to not only study our closest star, but also inspire artists. Some lines from The Broken Jar by Octavio Paz,
A world of spin and flame is born in the head of the dreamer, blue suns, green whirlwinds, bird beaks of light pecking open the pomegranate starsIn this next film scientists at UC Berkeley talk about their research and the secret lives of invisible magnetic fields are revealed as chaotic ever-changing geometries,
Photons take hundreds of thousands of years to random walk there way from the core [of the sun] all the way out to where we see them in the photosphere yet in a millionth of second a [magnetic field line] reconnection completely changes topology of the corona
Caustics
There are many sublime examples of physics in everyday life that I have come to appreciate. Given that it is summer I will talk about something that you are likely to see, but perhaps you can see it with new light soon.
I am simply going to talk about light rays, shadows, and shimmering in your pool. Watch the video. Notice the brightening of light into little wavering filaments (at about 40 seconds notice the nice filamentary structure of closed loops). The waves in the water's surface are bending the incoming light just like your glasses, a telescope, or a magnifying glass and focusing this diffuse incoming light into the bright areas and lines which you observe. The bright areas shimmer according the to shape of the surface of the water as waves perturb that smooth surface. The pattern of light can then be traced to the waves in the water and then to source of light. In theory there is a direct mathematical mapping to the light rays and the water waves. The places on the lensing plane (in this case the surface of the water) which cause a critical increase in brightness on the imaging plane (in this case the side of a pool) are known as caustics (and would roughly map out the crests of the tiny waves in the pool). In astronomy these shimmering lights rays in a pool are a great analogy for the physics underling some observed phenomena.
Gravitational lenses are a bonanza of science and beautiful images tied together. One of the more famous examples of gravitational lensing is Abell 2218 which is an entire galaxy cluster lensing the background field of galaxies.

At first glance I would not say that the similarities between this image and lights in your pool are particularity striking, but the redeeming factor here is the mathematics. It turns out that the math that describes the critical paths that a given photon will travel from the distant background galaxies through the massive gravitational pull of the foreground lensing cluster uses caustics. Imagine riding a photon from one of the distant galaxies relatively unimpeded until you finally interact with the gravitational field of a cluster of galaxies and then you continue to travel again relatively unimpeded until you are observed as a strongly lensed photon. This is exactly what a photon does as it enters the pool. It starts off at some light source, travels unimpeded, hits the surface of the water where it may be bent to some extreme at a caustic, and then it travels relatively unimpeded again until it is observed.
I am simply going to talk about light rays, shadows, and shimmering in your pool. Watch the video. Notice the brightening of light into little wavering filaments (at about 40 seconds notice the nice filamentary structure of closed loops). The waves in the water's surface are bending the incoming light just like your glasses, a telescope, or a magnifying glass and focusing this diffuse incoming light into the bright areas and lines which you observe. The bright areas shimmer according the to shape of the surface of the water as waves perturb that smooth surface. The pattern of light can then be traced to the waves in the water and then to source of light. In theory there is a direct mathematical mapping to the light rays and the water waves. The places on the lensing plane (in this case the surface of the water) which cause a critical increase in brightness on the imaging plane (in this case the side of a pool) are known as caustics (and would roughly map out the crests of the tiny waves in the pool). In astronomy these shimmering lights rays in a pool are a great analogy for the physics underling some observed phenomena.
Gravitational lenses are a bonanza of science and beautiful images tied together. One of the more famous examples of gravitational lensing is Abell 2218 which is an entire galaxy cluster lensing the background field of galaxies.
At first glance I would not say that the similarities between this image and lights in your pool are particularity striking, but the redeeming factor here is the mathematics. It turns out that the math that describes the critical paths that a given photon will travel from the distant background galaxies through the massive gravitational pull of the foreground lensing cluster uses caustics. Imagine riding a photon from one of the distant galaxies relatively unimpeded until you finally interact with the gravitational field of a cluster of galaxies and then you continue to travel again relatively unimpeded until you are observed as a strongly lensed photon. This is exactly what a photon does as it enters the pool. It starts off at some light source, travels unimpeded, hits the surface of the water where it may be bent to some extreme at a caustic, and then it travels relatively unimpeded again until it is observed.
Large scale structure is another aesthetically pleasing astronomical example that takes cues from the dancing lights in your pool. We can start exploring this strange similarity by looking in a strange place: the millennium run. It is a massive simulation astronomers created to examine the evolution of matter in the universe and the result has a clear visual and physical analogy to the filaments of light seen above. In the image below we see a slice through a three-dimensional dark matter distribution showing the structure of the cosmic-web.


The ripples of dark matter evident in the image were seeded by quantum fluctuations during the period of inflation just after the big bang. These minuscule primordial fluctuations expanded with inflation and continued to grow under the influence of gravity. While galaxies individually remain extremely complex statistically the universe has turned out to be simple and has followed closely to astrophysicist's linear predictions on scales greater than about 100 Mpc (that is a mega parsec which equals 1000 parsecs and that is about 2/3 of the way up our cosmic distance scale). We can examine statistics from our data to show that Fourier components of the density field are random, independent in phase, and are nearly scale invariant in power spectrum just as the theory predicts. If that didn't make any sense, don't worry because all you need to observe is that the theory and simulations display similar patterns to actual data that has been taken of galaxies, such as the image below from SDSS.
This image from the SDSS survey shows the distribution of galaxies we actually observe. Each dot represents a galaxy. Notice that their are voids and over densities in filaments and there is a preferred void and filament size. Galaxies merely cluster and form on top of the gravity dominating scaffold of dark matter; although this image and the millennium run are displaying two fundamentally different types of matter they look similar (and although they seem totally unrelated they also look just like the pool). The physics behind these patterns and the imprints seen in the Cosmic Microwave Background are known as acoustic peaks. They are literally oscillations of energy in the early universe and like an instrument's string that has been plucked the modes which resonate can tell us about the object resonating (also, the astute listener that the music accompaniment to the video is Johann Sebastian Bach's Cello Suite #1 in G major and this is no coincide). This may sound like all smoke and mirrors, but these acoustic peaks have been seen in the 2dFGRS and the SDSS. So if this all went over your head just realize that the striking part of all of this is that the patterns from astronomy match the patterns of light seen in any pool!

There is even more science you can think about in the pool this summer. Notice that the focused light on the sides or bottom of the pool is directly related to the current shape of the water's surface between where the light is being focused and the source of light. The really crazy thing to think about is this: there is roughly a certain size of focused light ray that is most common, meaning there is a certain size of wave disturbance in the pool that is most common, meaning that... Often the light rays form loopy circles of sort, but notice that the loops of light are not several meters in diameter nor are the less than a few centimeters in diameter. Nature has chosen a preferential size scale for these loops of light, just as it has chosen a preferential size scale for galaxy clusters! Why is this? Well, we could go through the looking glass here, but maybe it is time to let you just think it out on your own or relax by the pool.
Visualizing Astronomy
Most people's business on earth is only concerned with what is on earth, and reasonably so. However, a select few of us have a vested interest in what happens in the sky above earth. The common vein of humanity that connects us is that everyone wistfully looks up the the sky at some point in desperation or inspiration. But the city lights make it so you just can't see what you used to, but you can see something completely different on your computer. You can explore the sky with online star gazing tools even if you live in a big city. If you want to look at the sky right now and have a modern web browser the easiest way is jump right into it. There are several software programs I can mention including a Google project, a Microsoft project, and a vaguely related independent academic project.
 Google Sky is Google's star gazing tool that is packaged with Google Earth or available as an online version. Google sky is the most accessible, simple, and comprehensive sky tool at once I would say. I perceive Google Sky as simpler, faster and more effective than anything else, but I must state as a disclaimer that my view is colored by the fact that my advisor was the technical lead for the project and it remains a possibility that I may develop software widgets for it.

World Wide Telescope, WWT, by Microsoft is a multimedia star gazing extravaganza. There is a web based version, if you have Microsoft silver light installed. One of the current highlights I see is that it has tools for making professional looking presentations with links, videos, and seamless transitions that anyone in the community can create and so there are already some good presentations available. It can also incorporate external data sets and visualize the data in 3D which is their confusing attempt to get the professional astronomy community involved which seems to be very slow on the uptake. Last week a Microsoft employee came to UW and gave us a colloquium about the project. It seemed misguided because the real point of this program is that it just looks nice. Navigation is intuitive and with a right click you can get information about the current object and external links. The images in the sky are more seamlessly mosaiced and the entire experience seems more complete than Google sky, but the price you pay for this beauty and user interface is the slow speed at which imagery loads and the overall system demands, in fact if your trying to run the online version expect very slow frame rates. I would recommend downloading it, but you will still need a powerful windows system for an optimal experience.

Astrometry.net is something kind of different, but I am mentioning it here because it is sort of the professional version of these sky tools. The ostensible purpose of these sky tools is to enable the sharing of images of the sky of all varieties, at all wavelengths, and at all locations to anyone who wants to see them. But the reality is that most people who want to see these high fidelity images really just want to obtain calibrated standardized data ready for their code to read in. The public is only looking at a tiny tiny fraction of the data available and will never be interested in the statistical distribution of objects (unless it is in 3D of course, in which case it will hold their attention marginally longer). Astrometry.net is an 'astrometric calibration service to create correct, standards-compliant astrometric meta-data for every useful astronomical image ever taken, past and future, in any state of archival disarray. We hope this will help organize, annotate and make searchable all the world's astronomical information.' So, while people like to look at pretty images of the sky, astronomers want to analyze all images of the sky; a by product of this is that in the future the images will be readily uploaded to accessible sky visualizations for everyone to enjoy.
So I would recommend WWT for any student looking for the best astronomy multimedia available. I would recommend Google Sky for any browser anytime. I would recommend Astrometry.net for scientists. I will probably talk about astronomy a lot on this blag because that is what I do so if your ever looking for context to what I might be talking about this is where to look.
Google Sky is Google's star gazing tool that is packaged with Google Earth or available as an online version. Google sky is the most accessible, simple, and comprehensive sky tool at once I would say. I perceive Google Sky as simpler, faster and more effective than anything else, but I must state as a disclaimer that my view is colored by the fact that my advisor was the technical lead for the project and it remains a possibility that I may develop software widgets for it.World Wide Telescope, WWT, by Microsoft is a multimedia star gazing extravaganza. There is a web based version, if you have Microsoft silver light installed. One of the current highlights I see is that it has tools for making professional looking presentations with links, videos, and seamless transitions that anyone in the community can create and so there are already some good presentations available. It can also incorporate external data sets and visualize the data in 3D which is their confusing attempt to get the professional astronomy community involved which seems to be very slow on the uptake. Last week a Microsoft employee came to UW and gave us a colloquium about the project. It seemed misguided because the real point of this program is that it just looks nice. Navigation is intuitive and with a right click you can get information about the current object and external links. The images in the sky are more seamlessly mosaiced and the entire experience seems more complete than Google sky, but the price you pay for this beauty and user interface is the slow speed at which imagery loads and the overall system demands, in fact if your trying to run the online version expect very slow frame rates. I would recommend downloading it, but you will still need a powerful windows system for an optimal experience.
Astrometry.net is something kind of different, but I am mentioning it here because it is sort of the professional version of these sky tools. The ostensible purpose of these sky tools is to enable the sharing of images of the sky of all varieties, at all wavelengths, and at all locations to anyone who wants to see them. But the reality is that most people who want to see these high fidelity images really just want to obtain calibrated standardized data ready for their code to read in. The public is only looking at a tiny tiny fraction of the data available and will never be interested in the statistical distribution of objects (unless it is in 3D of course, in which case it will hold their attention marginally longer). Astrometry.net is an 'astrometric calibration service to create correct, standards-compliant astrometric meta-data for every useful astronomical image ever taken, past and future, in any state of archival disarray. We hope this will help organize, annotate and make searchable all the world's astronomical information.' So, while people like to look at pretty images of the sky, astronomers want to analyze all images of the sky; a by product of this is that in the future the images will be readily uploaded to accessible sky visualizations for everyone to enjoy.
So I would recommend WWT for any student looking for the best astronomy multimedia available. I would recommend Google Sky for any browser anytime. I would recommend Astrometry.net for scientists. I will probably talk about astronomy a lot on this blag because that is what I do so if your ever looking for context to what I might be talking about this is where to look.
Subscribe to:
Posts (Atom)